Automating the process of creating charts
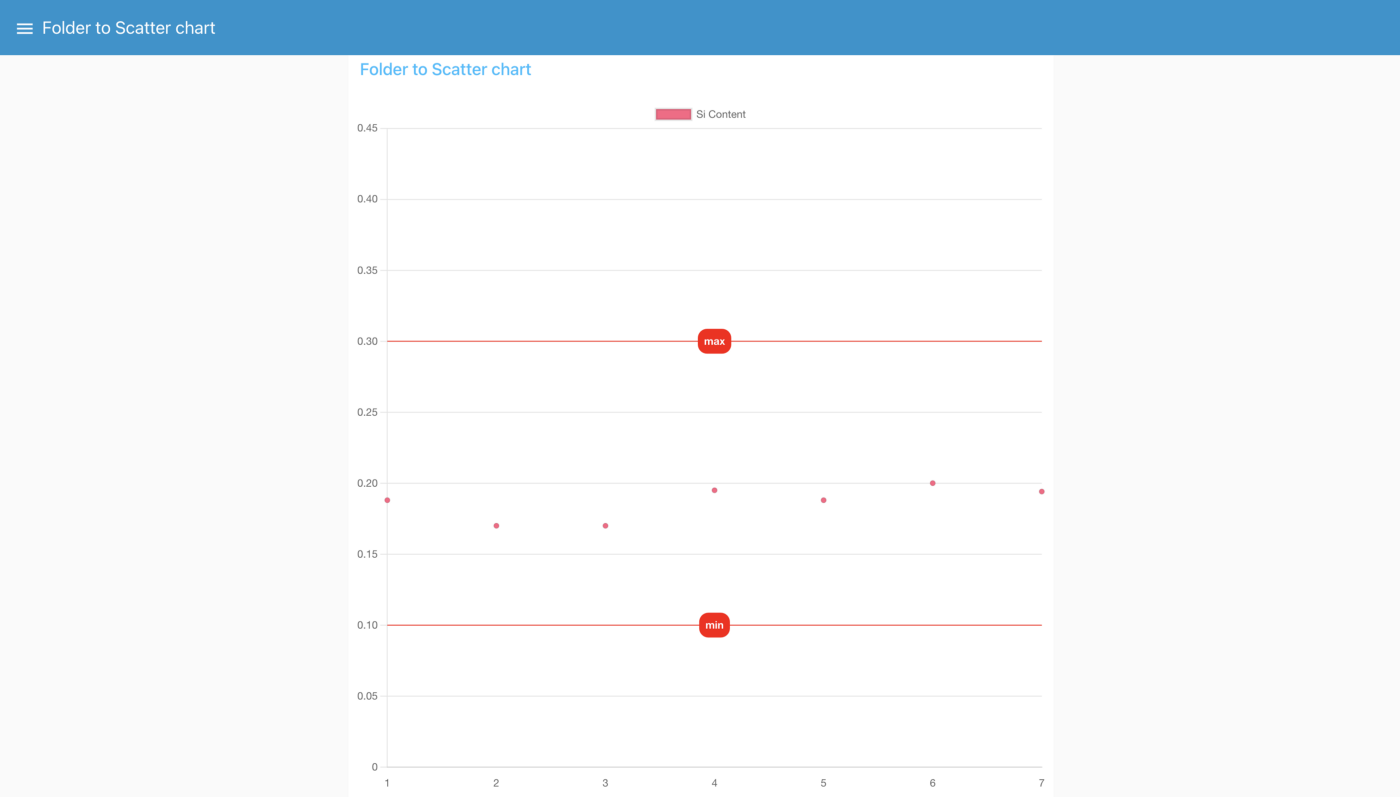
A scatter chart is a very useful tool, as it allows you to plot any property from a JSON certificate on a chart. It can be used, for example, to ensure the percentage of a particular element is within the required range and even compare the differences in composition between suppliers.
Example scatter chart
Reading PDFs and manually extracting the data to a chart is tedious and error-prone. With Node-Red, this process can be easily automated. What previously would have taken hours can now be done in just a few minutes.
In this example, we will take a folder containing EN10168 certificates, extract a property from the ChemicalComposition section and plot it to the chart. We will also add minimum and maximum lines to the chart for easier reading.
Installing dependencies
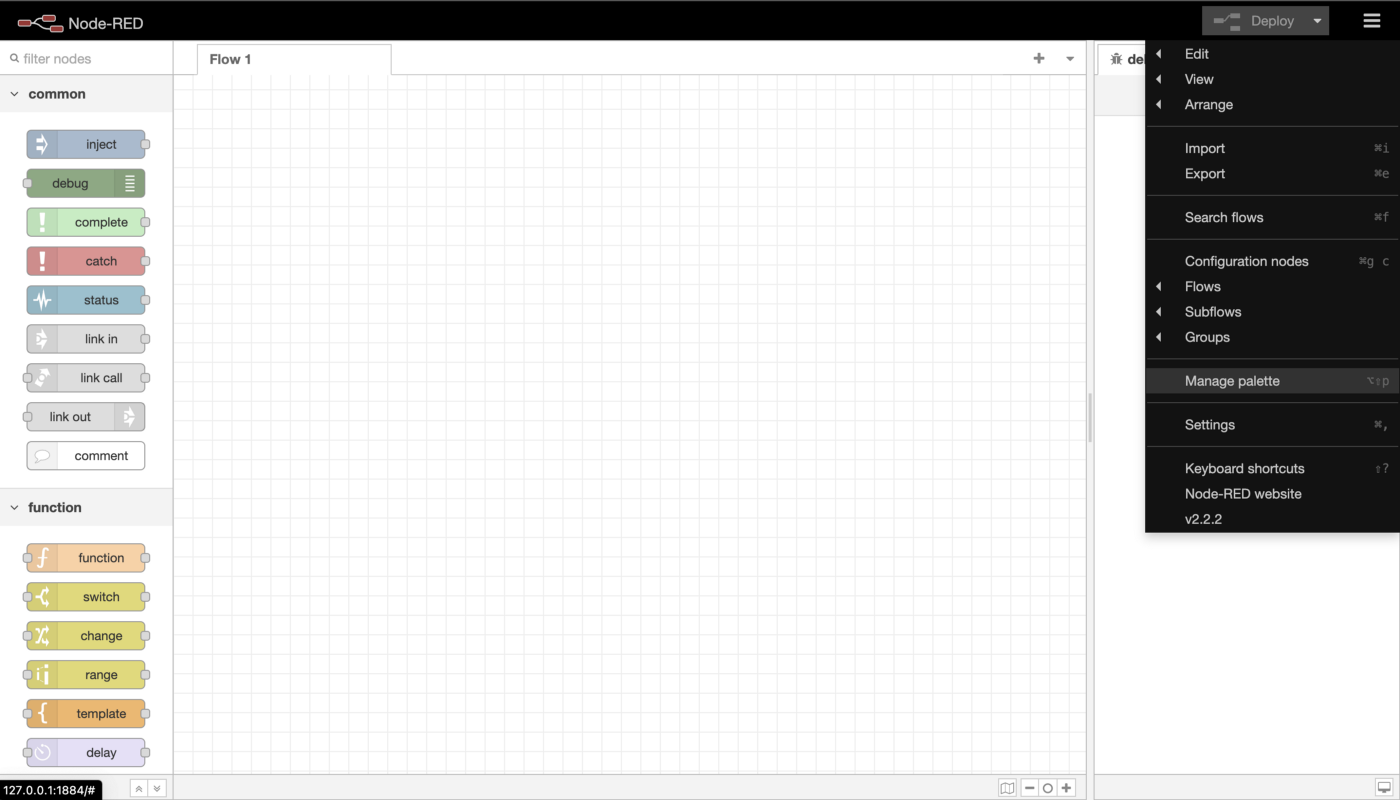
This project requires installing a custom module we created to simplify the process. With node-red, installing modules is easy. Simply click on the top-right menu button and select Manage palette from the drop-down menu.
Choose Manage palette from the menu
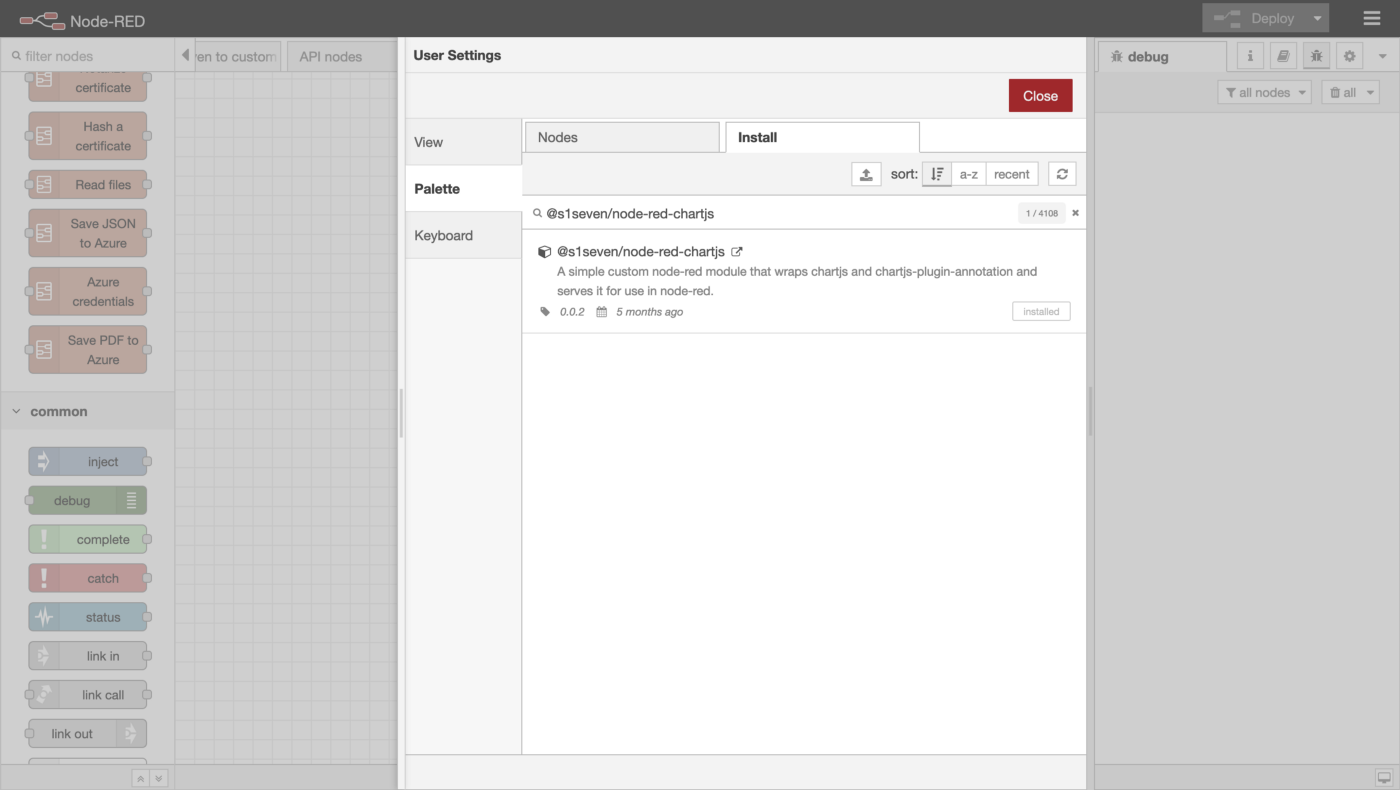
We need to install the following nodes: @s1seven/node-red-chartjs, node-red-contrib-fs-ops and node-red-dashboard. Just click on the Install tab, type in the name of the node you want to install, and click the install button.
Installing dependencies
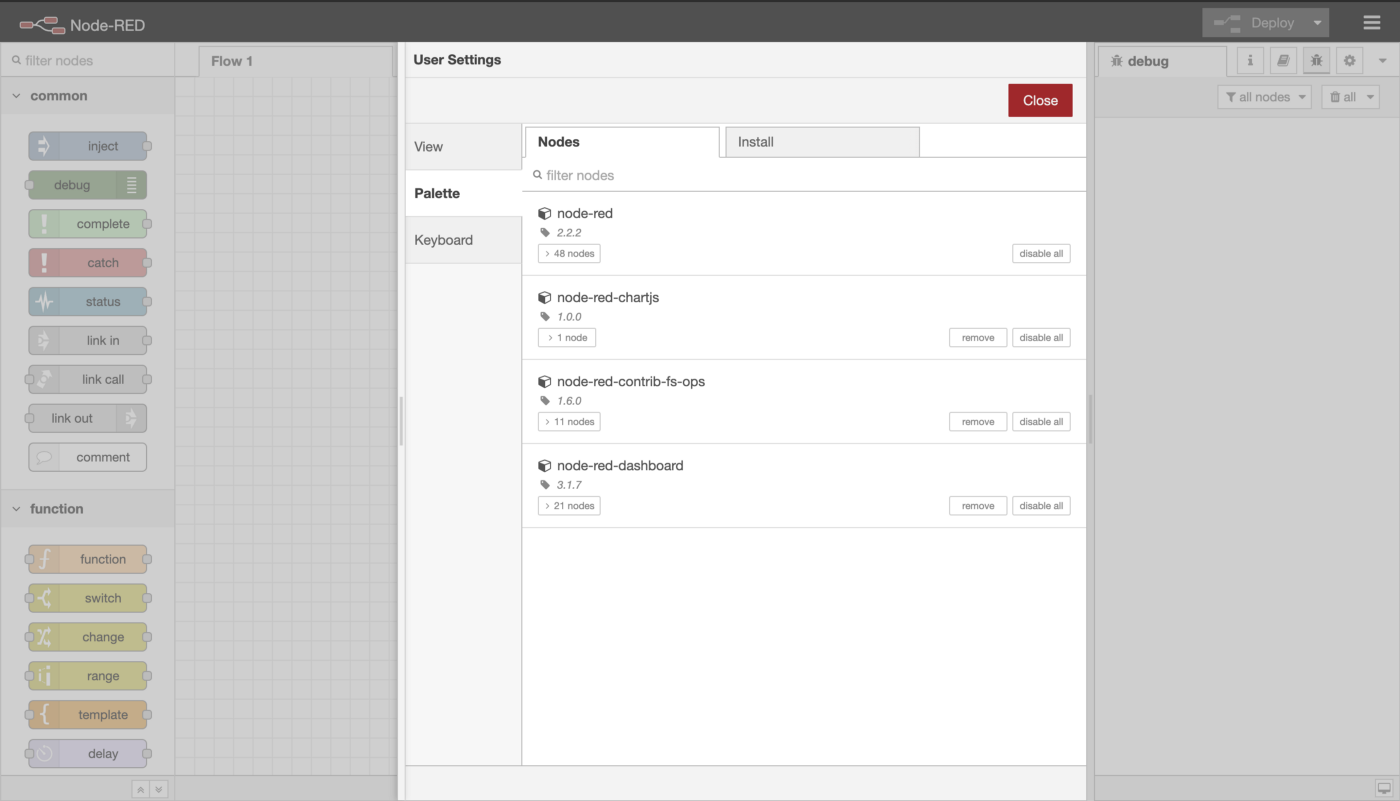
Once you have installed all three nodes, your Nodes tab should look like the one shown in the screenshot below:
Installed nodes
Add input to the dashboard
To get started, let’s import a flow that allows us to choose the element we want to plot to the chart from the certificate and set a maximum and minimum value.
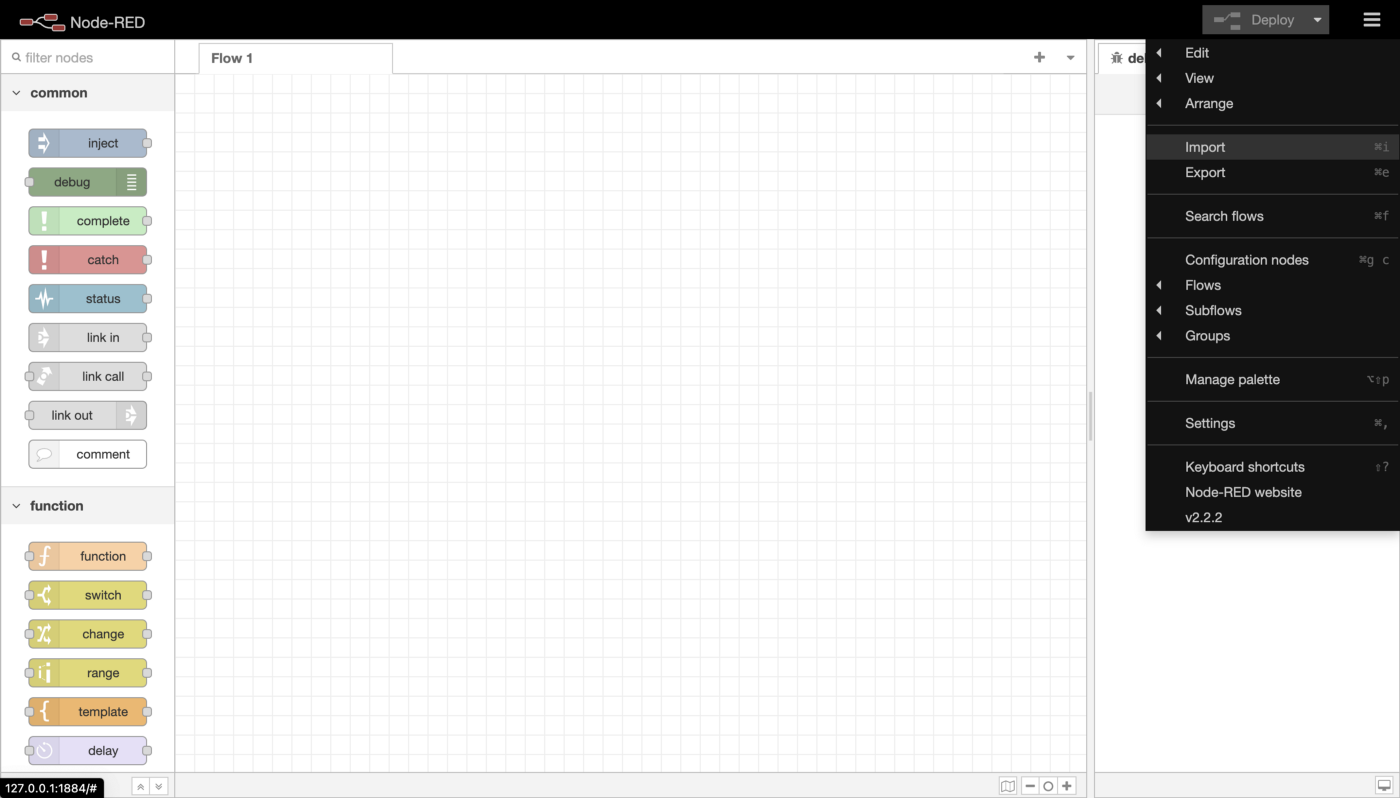
Open the drop-down menu at the top right again, and choose the Import option.
Import option in the drop-down menu
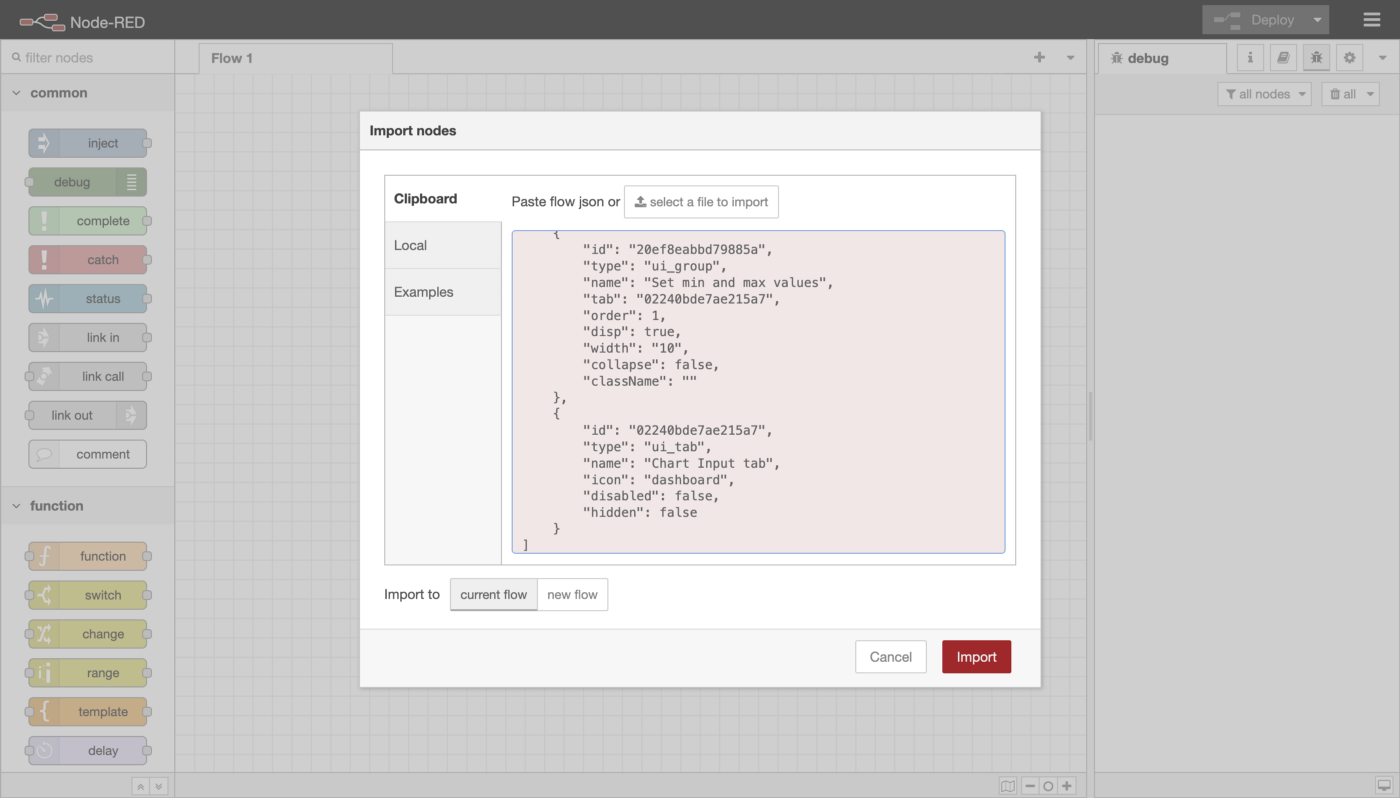
Choose the Clipboard tab, and copy-paste in all the code from the grey code box below this image, then click the red Import button:
Pasting in the code from below
[
{
"id": "2c0c61ec38837350",
"type": "ui_form",
"z": "bcc5874dd5736783",
"name": "",
"label": "Set min and max values to be shown on charts",
"group": "20ef8eabbd79885a",
"order": 2,
"width": 0,
"height": 0,
"options": [
{
"label": "Max",
"value": "Max",
"type": "number",
"required": true,
"rows": null
},
{
"label": "Min",
"value": "Min",
"type": "number",
"required": true,
"rows": null
}
],
"formValue": {
"Max": "",
"Min": ""
},
"payload": "",
"submit": "submit",
"cancel": "cancel",
"topic": "topic",
"topicType": "msg",
"splitLayout": "",
"className": "",
"x": 200,
"y": 200,
"wires": [
[
"f6aeebea1ee9100d"
]
]
},
{
"id": "162d1a9f2d836dc6",
"type": "ui_dropdown",
"z": "bcc5874dd5736783",
"name": "Select element to be shown on charts",
"label": "Select element",
"tooltip": "",
"place": "Select option",
"group": "20ef8eabbd79885a",
"order": 0,
"width": 0,
"height": 0,
"passthru": true,
"multiple": false,
"options": [
{
"label": "C",
"value": "C",
"type": "str"
},
{
"label": "Si",
"value": "Si",
"type": "str"
},
{
"label": "Mn",
"value": "Mn",
"type": "str"
},
{
"label": "P",
"value": "P",
"type": "str"
},
{
"label": "S",
"value": "S",
"type": "str"
},
{
"label": "Al",
"value": "Al",
"type": "str"
},
{
"label": "Cr",
"value": "Cr",
"type": "str"
},
{
"label": "Ni",
"value": "Ni",
"type": "str"
},
{
"label": "Mo",
"value": "Mo",
"type": "str"
},
{
"label": "Cu",
"value": "Cu",
"type": "str"
},
{
"label": "V",
"value": "V",
"type": "str"
},
{
"label": "Ti",
"value": "Ti",
"type": "str"
},
{
"label": "N",
"value": "N",
"type": "str"
},
{
"label": "B",
"value": "B",
"type": "str"
},
{
"label": "CEV",
"value": "CEV",
"type": "str"
}
],
"payload": "",
"topic": "topic",
"topicType": "msg",
"className": "",
"x": 170,
"y": 120,
"wires": [
[
"cc52a013f4d8ea54"
]
]
},
{
"id": "b2e75946981c4ff6",
"type": "debug",
"z": "bcc5874dd5736783",
"name": "",
"active": true,
"tosidebar": true,
"console": false,
"tostatus": false,
"complete": "false",
"statusVal": "",
"statusType": "auto",
"x": 810,
"y": 160,
"wires": []
},
{
"id": "cc52a013f4d8ea54",
"type": "function",
"z": "bcc5874dd5736783",
"name": "Set element globally",
"func": "if (msg.payload) {\n global.set('element', msg.payload);\n}\n\nreturn msg;",
"outputs": 1,
"noerr": 0,
"initialize": "",
"finalize": "",
"libs": [],
"x": 460,
"y": 120,
"wires": [
[
"b2e75946981c4ff6"
]
]
},
{
"id": "f6aeebea1ee9100d",
"type": "function",
"z": "bcc5874dd5736783",
"name": "Set min and max globally",
"func": "if (msg.payload) {\n global.set('max', msg.payload.Max);\n global.set('min', msg.payload.Min);\n}\n\nreturn msg;",
"outputs": 1,
"noerr": 0,
"initialize": "",
"finalize": "",
"libs": [],
"x": 530,
"y": 200,
"wires": [
[
"b2e75946981c4ff6"
]
]
},
{
"id": "20ef8eabbd79885a",
"type": "ui_group",
"name": "Set min and max values",
"tab": "02240bde7ae215a7",
"order": 1,
"disp": true,
"width": "10",
"collapse": false,
"className": ""
},
{
"id": "02240bde7ae215a7",
"type": "ui_tab",
"name": "Chart Input tab",
"icon": "dashboard",
"disabled": false,
"hidden": false
}
]
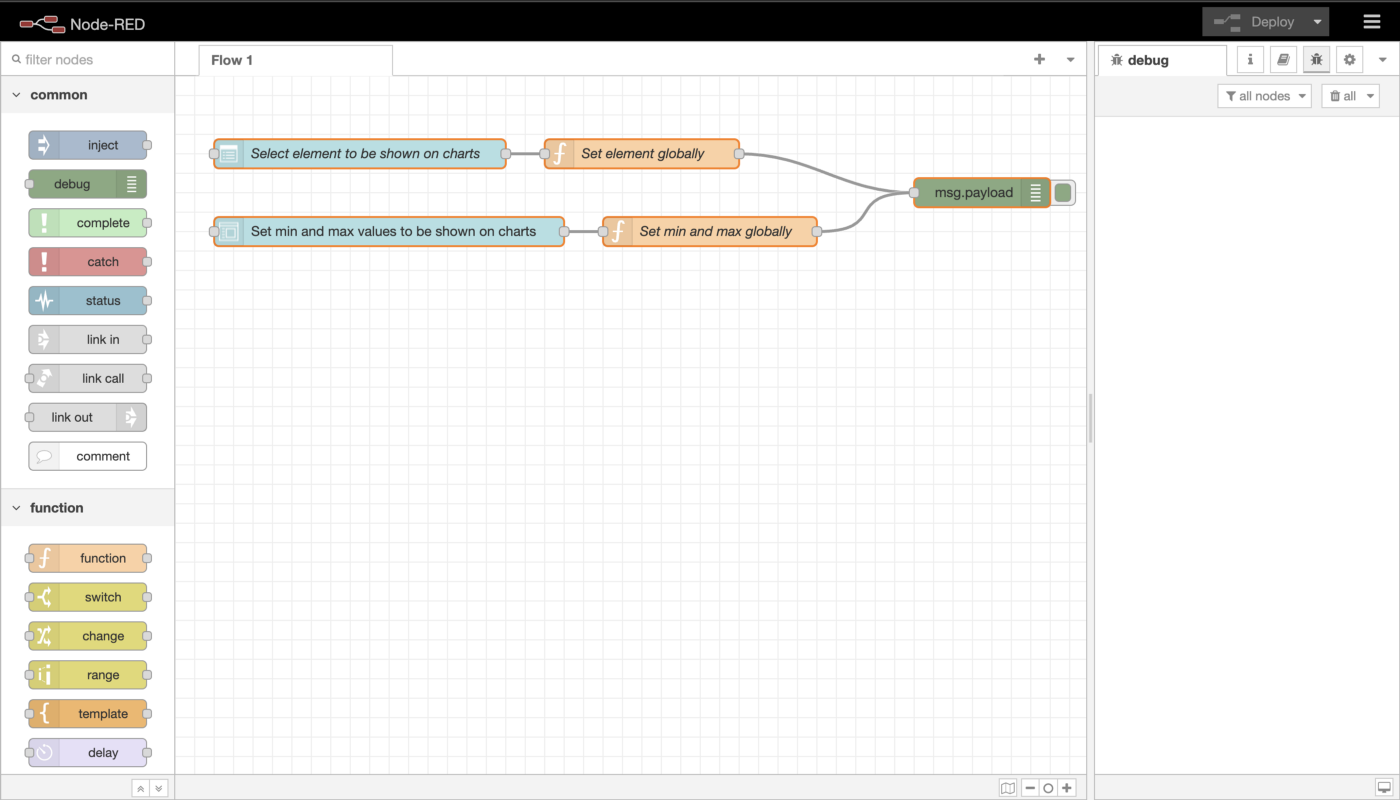
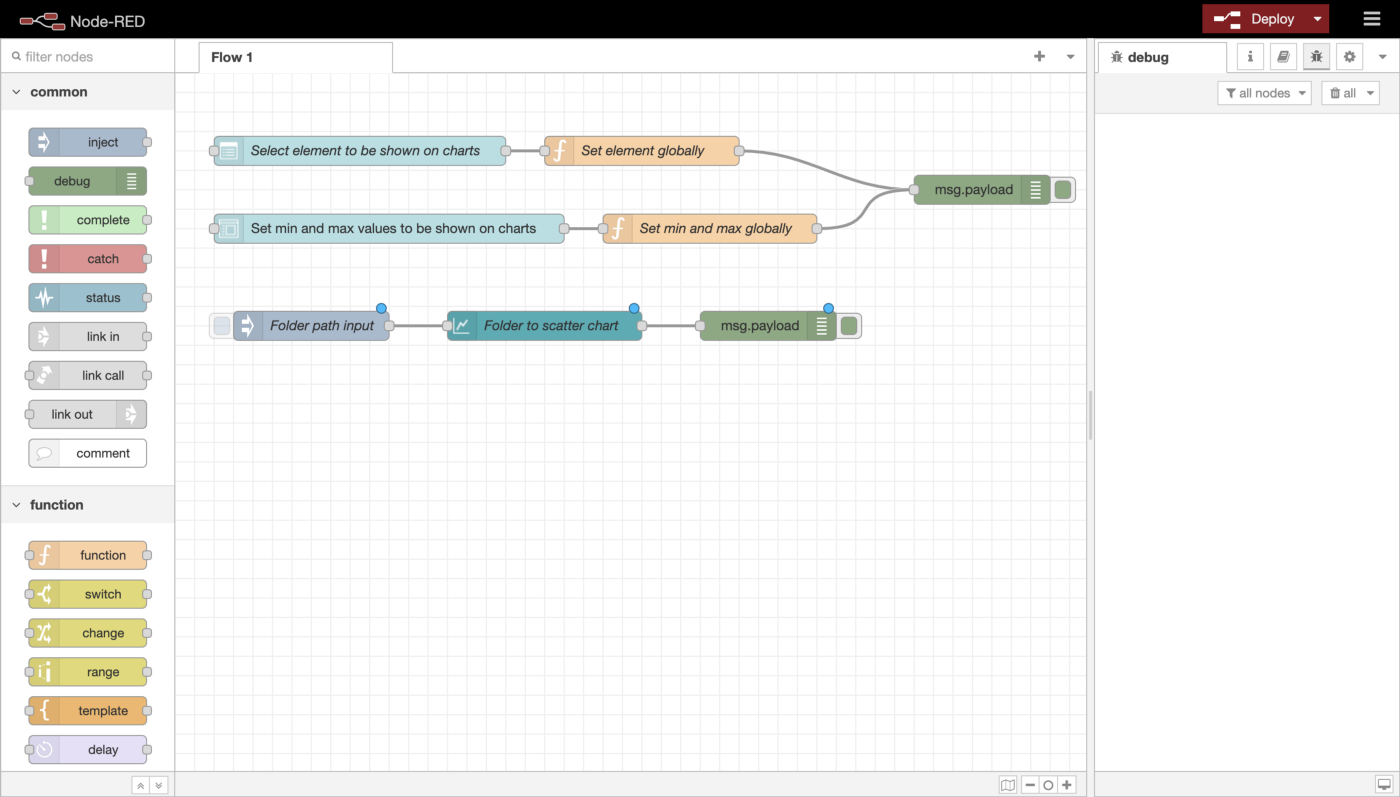
Now your flow should look something like this:
UI input flow
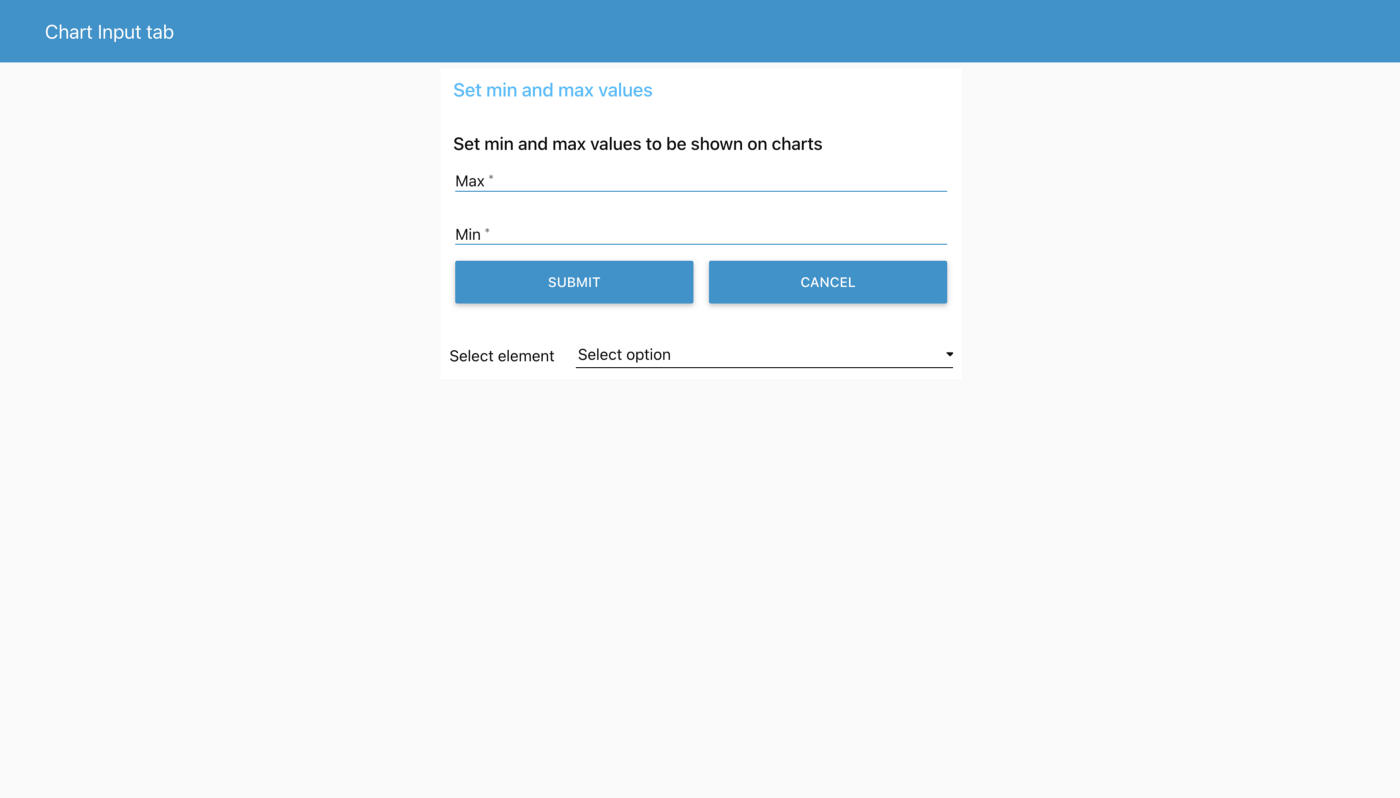
After clicking the red Deploy button, you should now be able to access the input tab via the UI. By default, if running node-red at localhost:1880, the UI will be available at localhost:1880/ui.
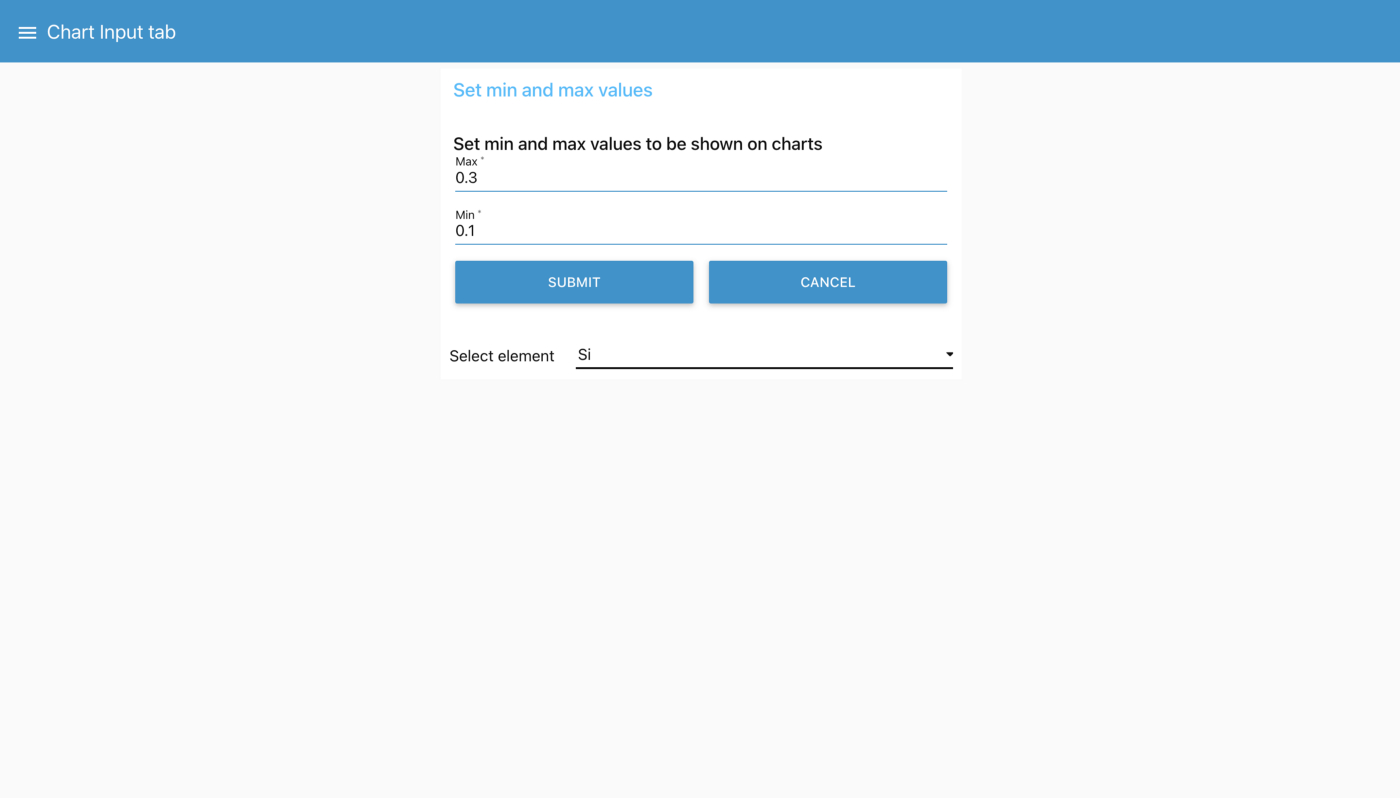
The input UI
As you can see, you can now set maximum and minimum values and select an element to extract from the JSON certificate.
Set up the chart flow
Switch back to the node-red workspace, and let’s add in the flow that will allow you to extract the data from the JSON certificate and plot it to a chart.
Select the import option from the drop-down menu, and paste in the following text:
[
{
"id": "f690adf5bb953586",
"type": "subflow",
"name": "Folder to Scatter Chart",
"info": "",
"category": "dashboard",
"in": [
{
"x": 20,
"y": 60,
"wires": [
{
"id": "577c5cbdda626823"
}
]
}
],
"out": [
{
"x": 1210,
"y": 260,
"wires": [
{
"id": "2353a48548a0e8eb",
"port": 0
}
]
}
],
"env": [],
"meta": {
"module": "folder-to-scatter-chart",
"author": "eamon@s1seven.com"
},
"color": "#3FADB5",
"inputLabels": [
"folder path"
],
"outputLabels": [
"chart data"
],
"icon": "node-red-dashboard/ui_chart.png"
},
{
"id": "25fe168f9510996c",
"type": "switch",
"z": "f690adf5bb953586",
"name": "Check msg.files contains a list of filenames",
"property": "files",
"propertyType": "msg",
"rules": [
{
"t": "istype",
"v": "array",
"vt": "array"
}
],
"checkall": "true",
"repair": false,
"outputs": 1,
"x": 890,
"y": 60,
"wires": [
[
"f5f7e42472e49966"
]
]
},
{
"id": "e2cccc27ec023551",
"type": "change",
"z": "f690adf5bb953586",
"name": "",
"rules": [
{
"t": "set",
"p": "payload",
"pt": "msg",
"to": "files",
"tot": "msg"
}
],
"action": "",
"property": "",
"from": "",
"to": "",
"reg": false,
"x": 600,
"y": 60,
"wires": [
[
"25fe168f9510996c"
]
]
},
{
"id": "f5f7e42472e49966",
"type": "split",
"z": "f690adf5bb953586",
"name": "Split array into individual filenames",
"splt": "\\n",
"spltType": "str",
"arraySplt": 1,
"arraySpltType": "len",
"stream": false,
"addname": "filename",
"x": 1240,
"y": 60,
"wires": [
[
"99111a44e1a9e052"
]
]
},
{
"id": "99111a44e1a9e052",
"type": "change",
"z": "f690adf5bb953586",
"name": "",
"rules": [
{
"t": "set",
"p": "filename",
"pt": "msg",
"to": "payload",
"tot": "msg"
}
],
"action": "",
"property": "",
"from": "",
"to": "",
"reg": false,
"x": 210,
"y": 160,
"wires": [
[
"4351fb0e176d3755"
]
]
},
{
"id": "4351fb0e176d3755",
"type": "function",
"z": "f690adf5bb953586",
"name": "Construct filepath",
"func": "msg.filename = msg.path + msg.filename;\nreturn msg;",
"outputs": 1,
"noerr": 0,
"initialize": "",
"finalize": "",
"libs": [],
"x": 430,
"y": 160,
"wires": [
[
"17939904dc357bed"
]
]
},
{
"id": "17939904dc357bed",
"type": "file in",
"z": "f690adf5bb953586",
"name": "",
"filename": "filename",
"filenameType": "msg",
"format": "utf8",
"chunk": false,
"sendError": false,
"encoding": "none",
"allProps": false,
"x": 620,
"y": 160,
"wires": [
[
"bc16451609ad7e6b"
]
]
},
{
"id": "bc16451609ad7e6b",
"type": "json",
"z": "f690adf5bb953586",
"name": "Covert to JSON",
"property": "payload",
"action": "",
"pretty": false,
"x": 820,
"y": 160,
"wires": [
[
"e93e0f79460e8085"
]
]
},
{
"id": "2353a48548a0e8eb",
"type": "ui_template",
"z": "f690adf5bb953586",
"group": "48449c35798e4e1d",
"name": "Display chart",
"order": 0,
"width": "15",
"height": "15",
"format": "",
"storeOutMessages": true,
"fwdInMessages": true,
"resendOnRefresh": true,
"templateScope": "local",
"className": "",
"x": 1030,
"y": 260,
"wires": [
[]
]
},
{
"id": "a576a4e46f45f5d5",
"type": "template",
"z": "f690adf5bb953586",
"name": "Create template for chart",
"field": "template",
"fieldType": "msg",
"format": "handlebars",
"syntax": "mustache",
"template": "<div>\n <canvas id=\"myChartScatter\" height=\"1\" width=\"1\"></canvas>\n</div>\n<script>\n\nnew Chart(document.getElementById('myChartScatter'), {\n type: 'scatter',\n data: {\n datasets: [{\n // label: 'Scatter Dataset',\n label: \"{{{payload.legend}}}\",\n data: {{{payload.data}}},\n showLine: false,\n backgroundColor: 'rgb(255, 99, 132)',\n }],\n },\n options: {\n title: {\n display: true,\n text: '{{{payload.title}}} Content',\n }, \n \n plugins: {\n autocolors: false,\n annotation: {\n annotations: {\n minLine: {\n type: 'line',\n borderColor: 'red',\n borderWidth: 1,\n label: {\n enabled: true,\n backgroundColor: 'red',\n borderColor: 'red',\n borderRadius: 10,\n borderWidth: 1,\n // content: (ctx) => 'Lower bound: ' + minValue(ctx).toFixed(3),\n content: 'min',\n rotation: 'auto'\n },\n scaleID: 'y',\n value: {{{min}}}\n },\n maxLine: {\n type: 'line',\n borderColor: 'red',\n borderWidth: 1,\n label: {\n enabled: true,\n backgroundColor: 'red',\n borderColor: 'red',\n borderRadius: 10,\n borderWidth: 1,\n content: 'max',\n rotation: 'auto'\n },\n scaleID: 'y',\n value: {{{max}}}\n },\n }\n }\n },\n\n scales: {\n y: {\n beginAtZero: true,\n suggestedMax: {{{max}}} * 1.5,\n },\n x: {\n grid: {\n display: false,\n },\n }\n }\n }\n});\n</script>\n ",
"output": "str",
"x": 810,
"y": 260,
"wires": [
[
"2353a48548a0e8eb"
]
]
},
{
"id": "51faac732d8b5afb",
"type": "ui_template",
"z": "f690adf5bb953586",
"group": "bc22481bfe8df892",
"name": "Load chart code",
"order": 1,
"width": 0,
"height": 0,
"format": "<script src=\"/resources/@s1seven/node-red-chartjs/chart.min.js\"></script>\n<script src=\"/resources/@s1seven/node-red-chartjs/chartjs-plugin-annotation.min.js\"></script>\n",
"storeOutMessages": true,
"fwdInMessages": true,
"resendOnRefresh": true,
"templateScope": "global",
"className": "",
"x": 580,
"y": 260,
"wires": [
[
"a576a4e46f45f5d5"
]
]
},
{
"id": "d7679c42451c8690",
"type": "function",
"z": "f690adf5bb953586",
"name": "Extract data for chart",
"func": "const min = global.get('min');\nconst max = global.get('max');\nconst element = global.get('element');\nmsg.min = min;\nmsg.max = max;\nmsg.propertyName = element;\n\nif (!msg.propertyName) {\n node.warn('Please select an element using the ui');\n} else if (typeof msg.min !== 'number') {\n node.warn('Please set the min and max values using the ui');\n} else {\n const chemicalCompositionObjects = msg.payload; //ChemicalComposition object\n const currentProperty = msg.propertyName; // e.g. 'Si'\n\n const scatterData = {\n title: '',\n legend: `${currentProperty} Content`,\n data: [],\n }\n\n chemicalCompositionObjects.forEach((dataPoint, index) => {\n // find the object that contains the correct property\n let foundObject;\n \n for (let prop in dataPoint) {\n if (dataPoint[prop].Symbol === currentProperty) {\n foundObject = dataPoint[prop];\n } \n }\n\n if (foundObject) {\n if (!scatterData.title) {\n scatterData.title = foundObject.Symbol;\n }\n scatterData.data.push({ x: index + 1, y: foundObject.Actual });\n \n if (foundObject.Actual < msg.min) {\n node.warn(`${foundObject.Symbol} value is less than the specified minimum in sample number ${index}`)\n } else if (foundObject.Actual > msg.max) {\n node.warn(`${foundObject.Symbol} value is greater than than the specified maximum in sample number ${index}`)\n }\n } else {\n node.warn('Element not found, ensure element exists in the Certificate under ChemicalAnalysis');\n } \n })\n\n scatterData.data = JSON.stringify(scatterData.data);\n msg.payload = scatterData;\n \n return msg;\n\n}\n\n",
"outputs": 1,
"noerr": 0,
"initialize": "",
"finalize": "",
"libs": [],
"x": 360,
"y": 260,
"wires": [
[
"51faac732d8b5afb"
]
]
},
{
"id": "de4b59cf1d0eb3a9",
"type": "join",
"z": "f690adf5bb953586",
"name": "",
"mode": "auto",
"build": "object",
"property": "payload",
"propertyType": "msg",
"key": "topic",
"joiner": "\\n",
"joinerType": "str",
"accumulate": true,
"timeout": "",
"count": "",
"reduceRight": false,
"reduceExp": "",
"reduceInit": "",
"reduceInitType": "",
"reduceFixup": "",
"x": 1310,
"y": 160,
"wires": [
[
"d7679c42451c8690"
]
]
},
{
"id": "e93e0f79460e8085",
"type": "change",
"z": "f690adf5bb953586",
"name": "Extract ChemicalComposition",
"rules": [
{
"t": "set",
"p": "certificate",
"pt": "msg",
"to": "payload",
"tot": "msg",
"dc": true
},
{
"t": "set",
"p": "payload",
"pt": "msg",
"to": "payload.Certificate.Inspection.ChemicalComposition",
"tot": "msg",
"dc": true
}
],
"action": "",
"property": "",
"from": "",
"to": "",
"reg": false,
"x": 1090,
"y": 160,
"wires": [
[
"de4b59cf1d0eb3a9"
]
]
},
{
"id": "577c5cbdda626823",
"type": "function",
"z": "f690adf5bb953586",
"name": "Check for filepath",
"func": "if (!msg.path) {\n node.warn(\"Please inject a filepath\");\n} else {\n return msg;\n}\n",
"outputs": 1,
"noerr": 0,
"initialize": "",
"finalize": "",
"libs": [],
"x": 170,
"y": 60,
"wires": [
[
"888889af44f458cf"
]
]
},
{
"id": "888889af44f458cf",
"type": "fs-ops-dir",
"z": "f690adf5bb953586",
"name": "Read directory",
"path": "path",
"pathType": "msg",
"filter": "*.json",
"filterType": "str",
"dir": "files",
"dirType": "msg",
"x": 380,
"y": 60,
"wires": [
[
"e2cccc27ec023551"
]
]
},
{
"id": "0da3dbaf27b2a6ec",
"type": "comment",
"z": "f690adf5bb953586",
"name": "The code for the charts is loaded from the @s1seven/node-red-chartjs module",
"info": "",
"x": 610,
"y": 320,
"wires": []
},
{
"id": "48449c35798e4e1d",
"type": "ui_group",
"name": "Folder to Scatter chart",
"tab": "38a292d30ab83f07",
"order": 1,
"disp": true,
"width": "15",
"collapse": false,
"className": ""
},
{
"id": "bc22481bfe8df892",
"type": "ui_group",
"name": "Default tab",
"tab": "6bdc7447c7d15906",
"order": 1,
"disp": true,
"width": "20",
"collapse": false,
"className": ""
},
{
"id": "38a292d30ab83f07",
"type": "ui_tab",
"name": "Folder to Scatter chart",
"icon": "dashboard",
"disabled": false,
"hidden": false
},
{
"id": "6bdc7447c7d15906",
"type": "ui_tab",
"name": "HTML",
"icon": "dashboard",
"disabled": false,
"hidden": false
},
{
"id": "175684a980d44a6e",
"type": "subflow:f690adf5bb953586",
"z": "c2b085695a656c4f",
"name": "",
"x": 500,
"y": 320,
"wires": [
[
"704a3d86af177b9d"
]
]
}
]
Now you should have a new node called Folder to scatter chart. Add an inject node and a debug node and connect them both to the Folder to scatter chart as you can see in the following screenshot:
New node
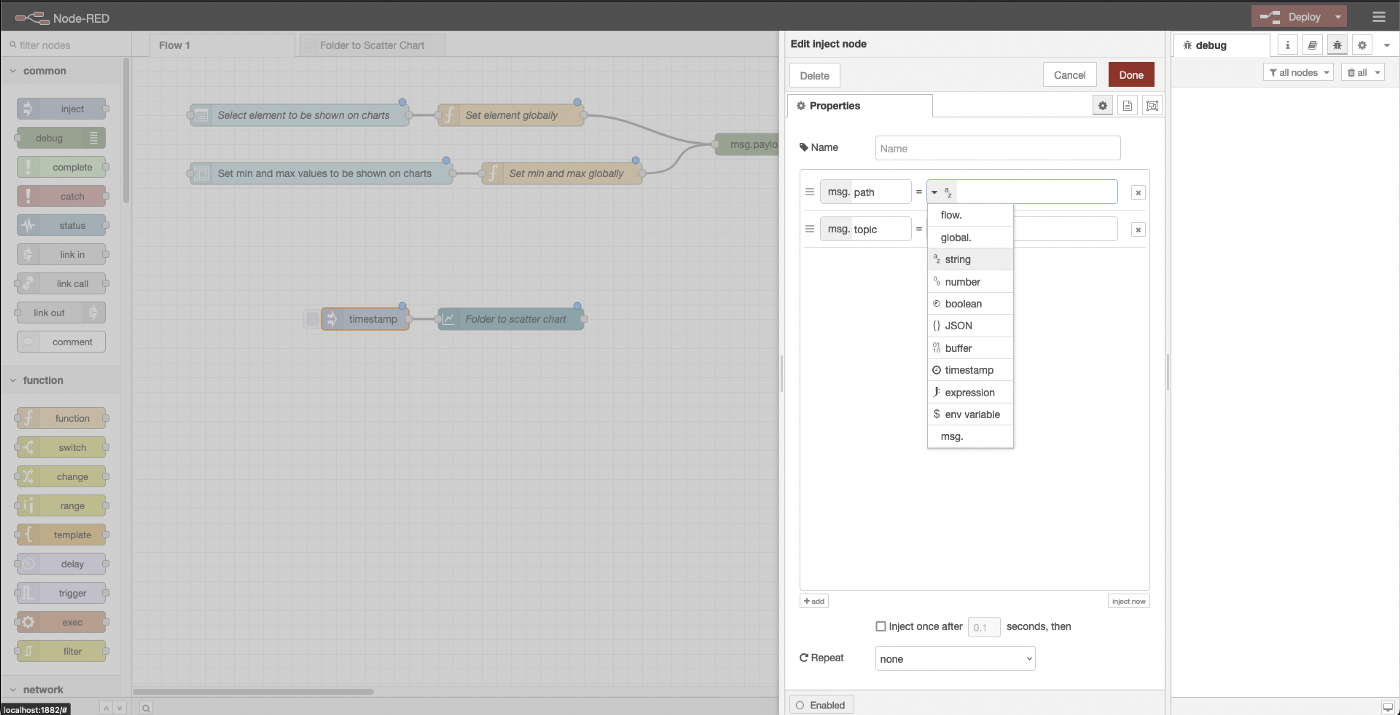
The first node is an inject node. Double-click on it, and change msg.payload to msg.path, and set its value type to a string like in the following screenshot:
Now set the value of msg.path to a file path. You need to get the absolute path to the folder containing your JSON certificates and paste it here.
For example, the path to my folder (on Mac) is /Users/eamon/certificates/graph_certs/. Make sure that your path ends with a / if on Mac or Linux or with a \ if on Windows. Otherwise, the flow will not be able to read the files correctly.
The second node, Folder to scatter chart is a subflow. A subflow allows you to group many nodes within one node. If you want to see more of the details of how it works, you can double-click on Folder to scatter chart and click the Edit subflow template button which will show you how it is implemented and allow you to modify it.
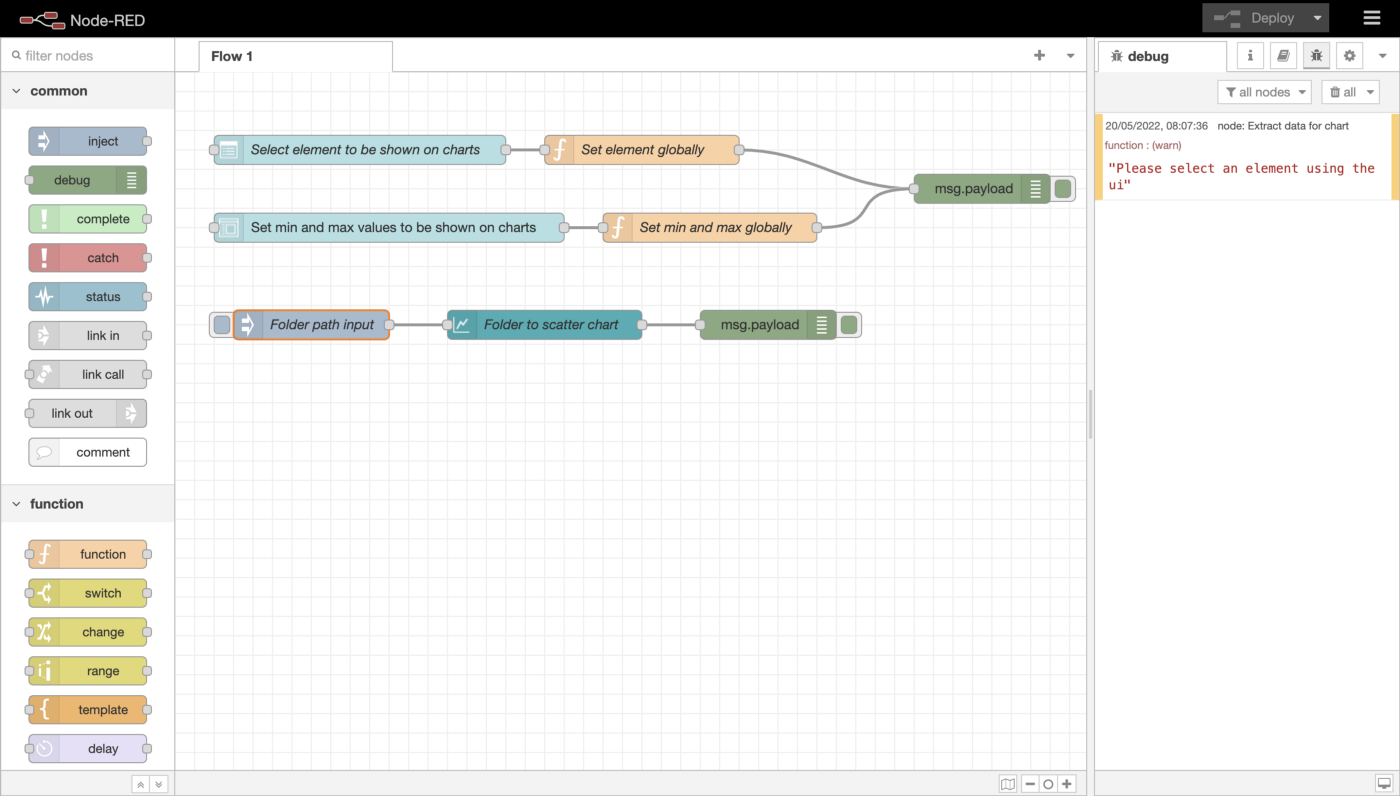
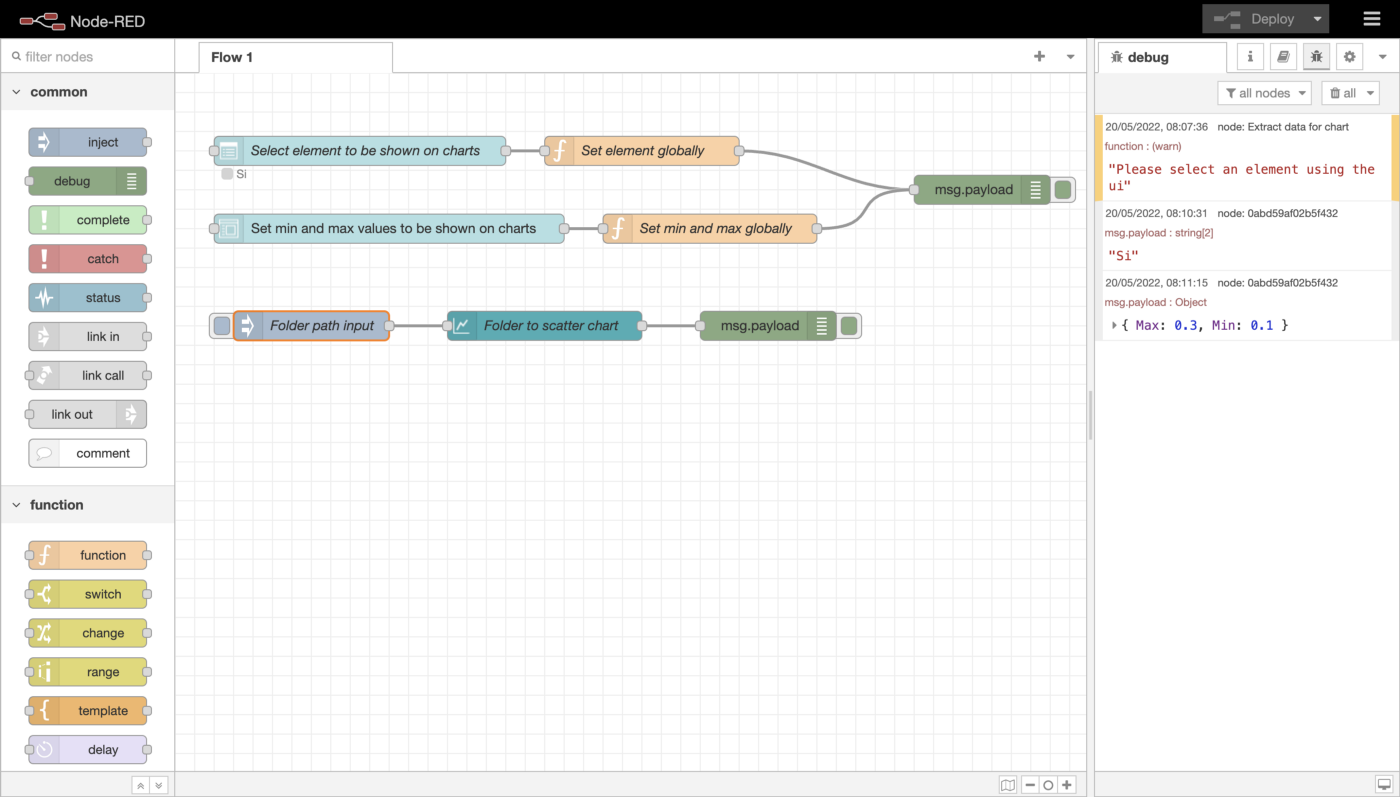
Hit the red Deploy button, and then click the inject button on the Folder path input node to inject the data. If you’ve followed these instructions exactly, you will see a warning in the debug tab to the right (if not, click on the small icon that looks like a bug).
Red warning message to the right
The message informs us that we haven’t selected an element using the UI, so the flow doesn’t know what data to extract from the graph. Let’s go back to the UI and select an element. Let’s also set a minimum and maximum value while we are at it.
For this example, I’m going to choose Si (silicon), and set the Max and Min values to 0.3 and 0.1 respectively.
Setting the max, min, and element via the UI
Be sure to hit the SUBMIT button after entering the min and max values. If you switch back to the node-red workspace, you will see the values you have just entered are printed on the debug tab on the right-hand side.
Si, Max, and Min have been set
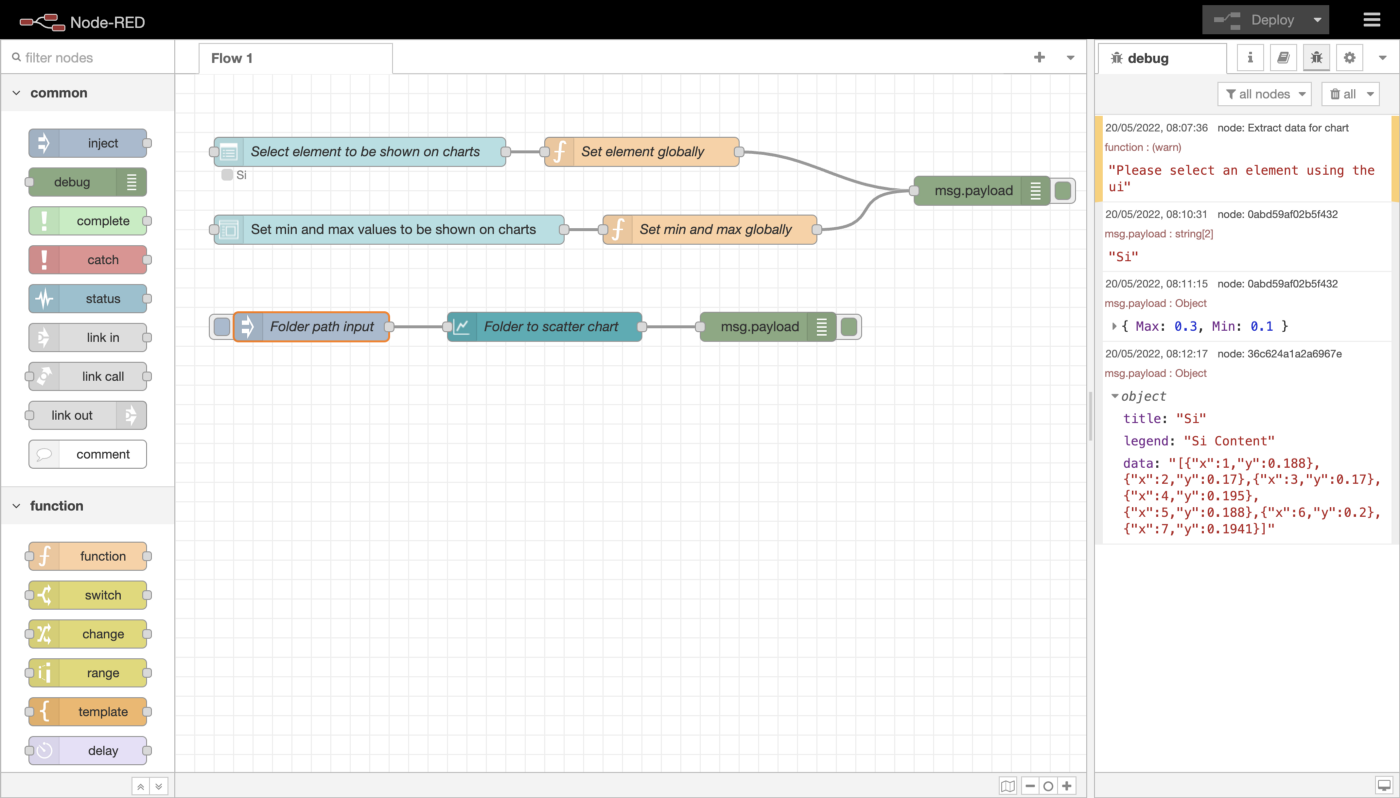
Now that we have set our values, we can click the inject button again, and we should see a new object printed to the debug tab:
New object in the debug tab
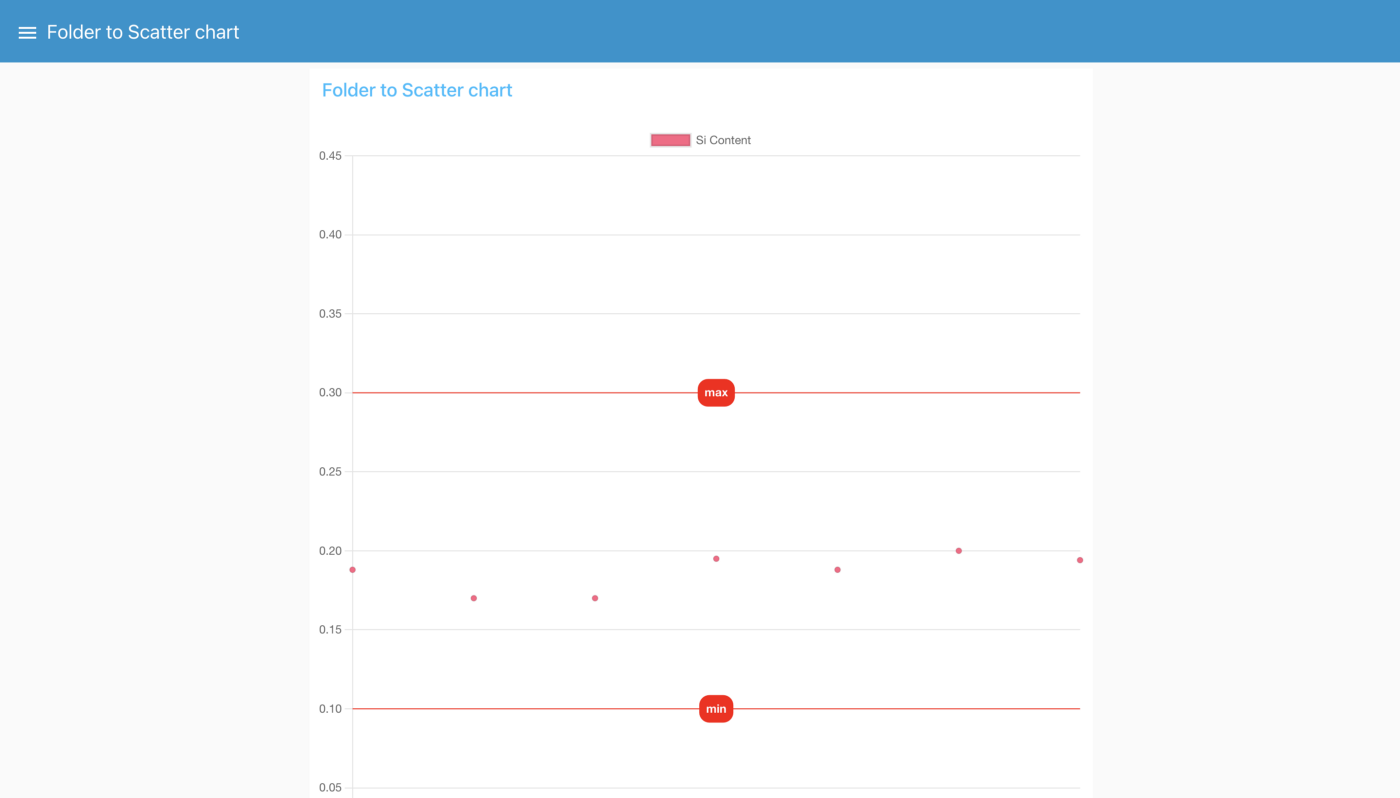
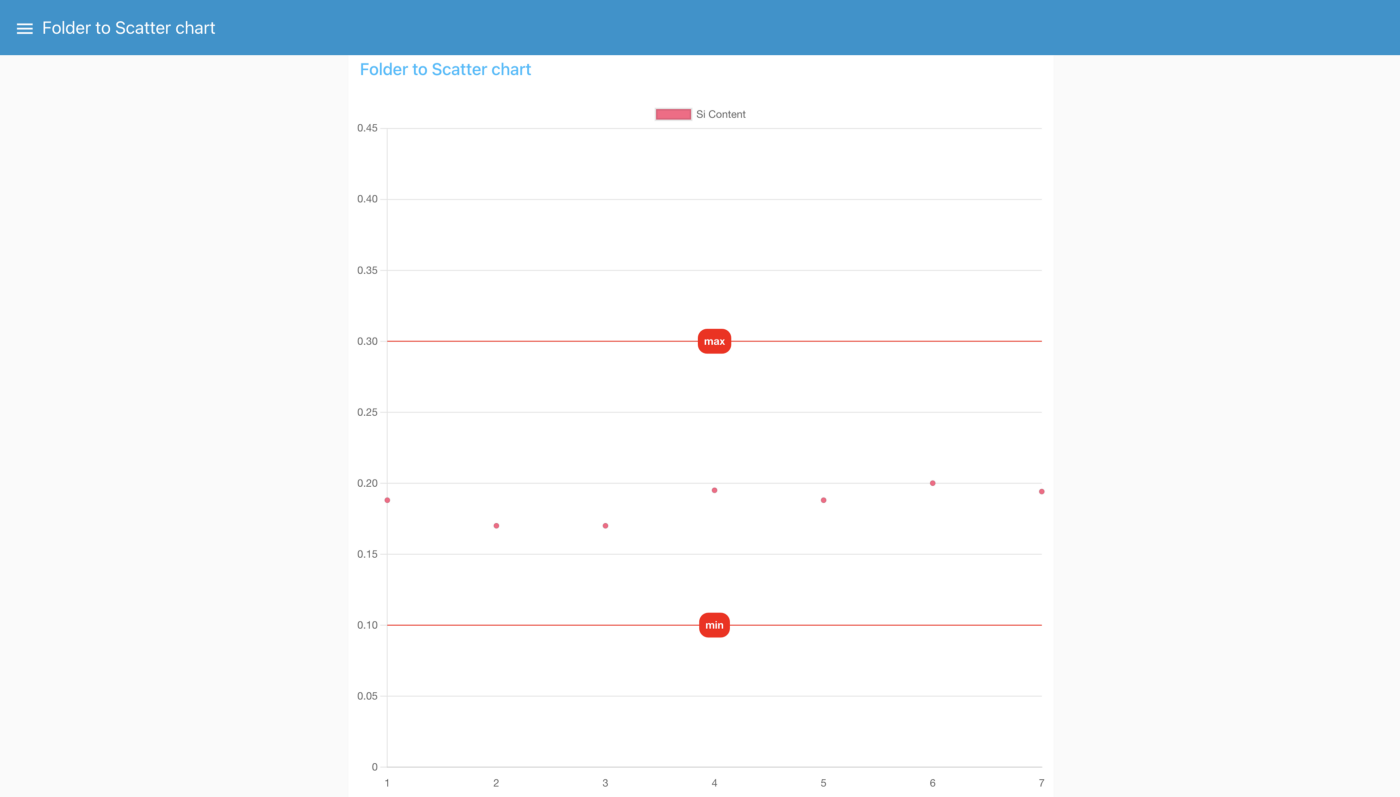
This object has three properties: title, legend and data. This object is passed to the code that generates the chart. The chart should now be visible. Go back to the ui tab (by default, localhost:1880/ui, choose the Folder to Scatter chart on the top left, where you should see something like the following chart:
Dynamically generated chart
Conclusion
As we have seen, extracting data from JSON certificates and plotting them to a chart is a relatively straightforward process. Of course, this flow can be easily customized or expanded. For example, we could add a flow that listens for incoming certificates from S1SEVEN’s servers and automatically plots them to a chart.
 Eamon O'Callaghan